I'm at the Predictive Analytics Summit in San Francisco. It is interesting to see the titles of Analytics people at the conference (here). They include CTO/Senior/Manager/VP of a variety of analytics variants: Predictive Analytics, Marketing Analytics, just Analytics, Data Analytics, Research & Analytics, Quant Research, etc. Others not here but that I've seen include Business Analytics and the variety of Data Mining titles.
There has been a lot of hype about data mining and predictive analytics being a great field to be in. It's interesting to me that (1) Predictive Analytics is so often part of the title now, lending credence to this term becoming a standard term companies use, and (2) the variety of ways quantitive modeling is described.
This conference is just one of many taking place in a short time period, including Predictive Analytics World, SAS M2010, IBM Information on Demand, and Teradata Partners conference, the SuperMath Conference in San Diego, and the ACM Data Mining Bootcamp in San Jose. Too many to attend all of them!
Thursday, November 04, 2010


Thursday, October 28, 2010
A humorous explanation of p-values
After Will's great post on sample sizes that referenced the youtube video entitled Statistics vs. Marketing, I found an equally funny and informative explanation on p-values here.
Aside from the esoteric explanations of what a p-value is, there is a point that I make often with customers that statistical significance (from p-values) is not the same thing as operational significance; just because you find a p-value of less than 0.05 doesn't mean the result is useful for anything! Enjoy.
Aside from the esoteric explanations of what a p-value is, there is a point that I make often with customers that statistical significance (from p-values) is not the same thing as operational significance; just because you find a p-value of less than 0.05 doesn't mean the result is useful for anything! Enjoy.
From the Archives: A Synopsis of Programming Languages
A departure from the usual data mining and predictive analytics posts...
I was looking at old articles I clipped from the 80s, and came across my favorite programming article from the days I used to program a lot (mostly C, some FORTRAN, sh, csh, tcsh). This one from the C Advisor by Ken Arnold I found funny then, and still do now. I don't know where these are archived, so I'll just quote an excerpt here:
C advisor article by Ken Arnold from years and years ago quoting Richard Curtis
I was looking at old articles I clipped from the 80s, and came across my favorite programming article from the days I used to program a lot (mostly C, some FORTRAN, sh, csh, tcsh). This one from the C Advisor by Ken Arnold I found funny then, and still do now. I don't know where these are archived, so I'll just quote an excerpt here:
C advisor article by Ken Arnold from years and years ago quoting Richard Curtis
• FORTRAN was like the fifties: It's rigid and procedural, and doesn't even distinguish between cases. It's motto is "Do my thing".
• C is a real sixties language, because it just doesn't care. It doesn't type check, and it lets you get into as much trouble as you can--you own your own life. C's motto: "Do your own thing".
• Pascal is the seventies. It tries to seize control of the wild and woolly sixties, without getting too restrictive. It thus ends up pleasing no one. It's full of self-justification and self-importance--going from C to Pascal is like going from Janis Joplin to Donna Summer. It is smooth and flashy and useless for major work--truly the John Travolta of programming languages. The Pascal motto is: "Do your thing my way".
• ADA is the eighties. There is no overarching philosophy; everything is possible, but there is no ethical compass to tell you what ought to be done. (Actually, I know of two things you can't do in ADA, but I'm not telling for fear they'll be added.) It reflects the eighties notion of freedom, which is that you are free to do anything, as long as you do it the way the government wants you to--that is, in ADA. It's credo: "Do anything anyway you want".
Sunday, October 24, 2010
The Data Budget
Larger quantities of data permit greater precision, greater certainty and more detail in analysis. As observation counts increase, standard errors decrease and the opportunity for more detailed- perhaps more segmented- analysis rises. These are things which are obvious to even junior analysts: The standard error of the mean is calculated as the standard deviation divided by the square root of the observation count.
This general idea may seem obvious when spoken aloud, but it is something which many non-technical people seem to give little thought. Ask any non-technical client whether more data will provide a better answer, and the response will be in the affirmative. It is a simple trend to understand.
However, people who do not analyze data for a living do not necessarily think about such things in precise terms. On too many occasions, I have listened to managers or other customers indicate that they wanted to examine data set X and test Y things. Without performing any calculations, I had strong suspicions that it would not be feasible to test Y things, given the meager size of data set X. Attempts to explain this have been met with various responses. To be fair, some of them were constructive acknowledgments of this unfortunate reality, and new expectations were established. In other cases, I was forced to be the insistent bearer of bad news.
In one such situation, a data set with less than twenty thousand observations was to be divided among about a dozen direct mail treatments. Expected response rates were typically in the single-digit percents, meaning that only a few hundred observations would be available for analysis. Treatments were to be compared based on various business metrics (customer spending, etc.). Given the small number of respondents and high variability of this data, I realized that this was unlikely to be productive. I eventually gave up trying to explain the futility of this exercise, and resigned myself to listening to biweekly explanations the noisy graphs and summaries. One day, though, I noticed that one of the cells contained a single observation! Yes, much energy and attention was devoted to tracking this "cell" of one individual, which of course would have no predictive value whatsoever.
It is important for data analysts to make clear the limitations of our craft. One such limitation is the necessity of sufficient data from which to draw reasonable and useful conclusions. It may be helpful to indicate this important requirement as the data budget: "Given the quality and volume of our historical data, we only have the data budget to answer questions about 3 segments, not 12." Simply saying "We don't have enough data" is not effective (so I have learned through painful experience). Referring to this issue in terms which others can appreciate may help.
This general idea may seem obvious when spoken aloud, but it is something which many non-technical people seem to give little thought. Ask any non-technical client whether more data will provide a better answer, and the response will be in the affirmative. It is a simple trend to understand.
However, people who do not analyze data for a living do not necessarily think about such things in precise terms. On too many occasions, I have listened to managers or other customers indicate that they wanted to examine data set X and test Y things. Without performing any calculations, I had strong suspicions that it would not be feasible to test Y things, given the meager size of data set X. Attempts to explain this have been met with various responses. To be fair, some of them were constructive acknowledgments of this unfortunate reality, and new expectations were established. In other cases, I was forced to be the insistent bearer of bad news.
In one such situation, a data set with less than twenty thousand observations was to be divided among about a dozen direct mail treatments. Expected response rates were typically in the single-digit percents, meaning that only a few hundred observations would be available for analysis. Treatments were to be compared based on various business metrics (customer spending, etc.). Given the small number of respondents and high variability of this data, I realized that this was unlikely to be productive. I eventually gave up trying to explain the futility of this exercise, and resigned myself to listening to biweekly explanations the noisy graphs and summaries. One day, though, I noticed that one of the cells contained a single observation! Yes, much energy and attention was devoted to tracking this "cell" of one individual, which of course would have no predictive value whatsoever.
It is important for data analysts to make clear the limitations of our craft. One such limitation is the necessity of sufficient data from which to draw reasonable and useful conclusions. It may be helpful to indicate this important requirement as the data budget: "Given the quality and volume of our historical data, we only have the data budget to answer questions about 3 segments, not 12." Simply saying "We don't have enough data" is not effective (so I have learned through painful experience). Referring to this issue in terms which others can appreciate may help.
Thursday, October 21, 2010
Predictive Analytics World Addresses Risk and Fraud Detection
Eric Siegel focused his plenary session on predicting and assessing risk in the enterprise, and in his usual humorous way, described how big, macro or catastrophic risk often dominates thinking, micro or transactional risk can cost organizations more than macro risk. The micro risk is where predictive analytics is well suited, what he called data-driven micro risk management.
The point is well-taken because the most commonly used PA techniques are work better with larger data than "one of a kind" events. Micro risk can be quantified in a PA framework well.
During the second day, an excellent talk described a fraud assessment application in the insurance industry. While the entire CRISP-DM process were covered in this talk (from Business Understanding through Deployment), there was one aspect that struck me in particular, namely the definition of the target variable to predict. Of course, the most natural target variable for fraud detection is a label indicating if a claim has been shown to be fraudulent. Fraud often has a legal aspect to it, where a claim can only be truly "fraud" after it has been prosecuted and the case closed. This has at least two difficulties for analytics. First, it can take quite some time for a case to close, making the data one has for building fraud models lag by perhaps years from when the fraud was perpetrated. Patterns of fraud change, and thus models may perpetually be behind in identifying the fraud patterns.
Second, a there are far fewer actual proven fraud cases compared to those that are suspicious and worthy of investigation. Cases may be dismissed or "flushed" for a variety of reasons ranging from lack of resources to investigate, statutory restrictions, and legal loopholes which do not reduce the risk for a particular claim at all, but rather just change the target variable (to 0), making these cases appear the same as benign cases.
In this case study, the author described a process where another label for risk was used, a human-generated label that only indicated a high-enough level of suspicious behavior rather than only using actual claims fraud, a good idea in my opinion.
Friday, October 15, 2010

Thursday, October 07, 2010
A little math humor, and achieving clarity in explaining solutions
This is still one of my favorite cartoons of all time (by S. Harris). I think we've all been there before, trying to waive our hands in place of providing a good reason for the procedures we use.

A closely related phenomenon is when you receive an explanation for a business process that is "proof by confusion", whereby the person explaining the process uses lots of buzz words and complex terminology in place of clarity, probably because the person him or herself doesn't really understand it him/herself.
This is why clarifying questions are so key. I remember a professor of mathematics of mine at Rensselaer Polytechnic Institute named David Isaacson who told a story of a graduate seminar. If you have ever experienced these seminars, there are two distinguishing features: the food, that goes quickly to those who arrive on time, and the game involved of the speaker trying to lose the graduate students during the lecture (an overstatement, but a frequently occurring outcome). Prof. Isaacson told us of a guy there who would ask dumb questions from the get-go: questions that we all knew the answer to and most folks thought were obvious. But as the lecture continued, this guy was the only one left asking questions, and of course was the only one who truly understood the lecture. What was happening is that he was constantly aligning what he thought he heard by asking for clarification. The rest of those in the room thought they understood, but in reality did not.
It reminds me to ask questions, even the dumb ones if it means forcing the one who is teaching or explaining to restate their point in different words, thus providing better opportunity for true communication.
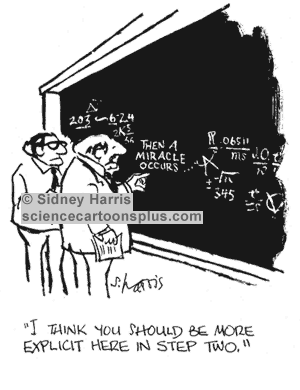
A closely related phenomenon is when you receive an explanation for a business process that is "proof by confusion", whereby the person explaining the process uses lots of buzz words and complex terminology in place of clarity, probably because the person him or herself doesn't really understand it him/herself.
This is why clarifying questions are so key. I remember a professor of mathematics of mine at Rensselaer Polytechnic Institute named David Isaacson who told a story of a graduate seminar. If you have ever experienced these seminars, there are two distinguishing features: the food, that goes quickly to those who arrive on time, and the game involved of the speaker trying to lose the graduate students during the lecture (an overstatement, but a frequently occurring outcome). Prof. Isaacson told us of a guy there who would ask dumb questions from the get-go: questions that we all knew the answer to and most folks thought were obvious. But as the lecture continued, this guy was the only one left asking questions, and of course was the only one who truly understood the lecture. What was happening is that he was constantly aligning what he thought he heard by asking for clarification. The rest of those in the room thought they understood, but in reality did not.
It reminds me to ask questions, even the dumb ones if it means forcing the one who is teaching or explaining to restate their point in different words, thus providing better opportunity for true communication.
Friday, September 24, 2010
Theory vs. Practice
In many fields, it is common to find a gap between theorists and practitioners. As stereotypes, theorists have a reputation for sniffing at anything which has not been optimized and proven to the nth degree, while practitioners show little interest in theory, as it "only ever works on paper".
I have been amazed at both extremes of this spectrum. Academic and standards journals seem to publish mostly articles which solve theoretical problems which will never arise in practice (but which permit solutions which are elegant or which can be optimized to some ridiculous level), or solutions which are trivial variations on previous work. The same goes for most masters and doctoral theses. On the other hand, I was shocked when software development colleagues (consultants: the last word in practice over theory) were unfamiliar with two's complement arithmetic.
Data mining is certainly not immune to this problem. Not long ago, I came upon technical documentation for a linear regression which had been "fixed" by a logarithmic transformation of the dependent variable. (There is a correct way to fit coefficients in this circumstance, but that was not done in this case.) Even more astounding was the polynomial curve fit which was applied to "undo" the log transformation, to get back to the original units! Sadly, the practitioners in question did not even recognize the classic symptom of their error: residuals were much larger at the high end of their plots.
Data miners (statisticians, quantitative analysts, forecasters, etc.) come from a variety of fields, and enjoy diverse levels of formal training. Grounding in theory follows suit. The people we work for typically are capable of identifying only the most egregious technical errors in our work. This sets the stage for potential problems.
As a practitioner, I have found much that is useful in theory and suggest that it is a fountain which is worth returning to, from time to time. Reviewing new developments in our field, searching for useful techniques and guidance will benefit data miners, regardless of their seniority.
I have been amazed at both extremes of this spectrum. Academic and standards journals seem to publish mostly articles which solve theoretical problems which will never arise in practice (but which permit solutions which are elegant or which can be optimized to some ridiculous level), or solutions which are trivial variations on previous work. The same goes for most masters and doctoral theses. On the other hand, I was shocked when software development colleagues (consultants: the last word in practice over theory) were unfamiliar with two's complement arithmetic.
Data mining is certainly not immune to this problem. Not long ago, I came upon technical documentation for a linear regression which had been "fixed" by a logarithmic transformation of the dependent variable. (There is a correct way to fit coefficients in this circumstance, but that was not done in this case.) Even more astounding was the polynomial curve fit which was applied to "undo" the log transformation, to get back to the original units! Sadly, the practitioners in question did not even recognize the classic symptom of their error: residuals were much larger at the high end of their plots.
Data miners (statisticians, quantitative analysts, forecasters, etc.) come from a variety of fields, and enjoy diverse levels of formal training. Grounding in theory follows suit. The people we work for typically are capable of identifying only the most egregious technical errors in our work. This sets the stage for potential problems.
As a practitioner, I have found much that is useful in theory and suggest that it is a fountain which is worth returning to, from time to time. Reviewing new developments in our field, searching for useful techniques and guidance will benefit data miners, regardless of their seniority.
Tuesday, September 07, 2010
DM Radio - Predictive Analytics and Fraud Detection
I'll be on DM Radio Thursday September 9 at 3pm EDT. Here's the blurb:
How many ways to catch a thief? More and more, thanks to predictive analytics, data-as-a-service and other clever computing tricks. Stopping fraud in its tracks can save customers, money and more. Tune into this episode of DM Radio to find out how. We'll hear from Eric Siegel, Prediction Impact; Erick Brethenoux, SPSS; Jason Trunk, Quest Software and Dean Abbott, Abbott Analytics.
Thursday, September 02, 2010
Leo Breiman quote about statisticians
One nice thing about having to move offices is that it forces you to go through old papers and folders. I found my folder containing KDD 97 conference notes, including quotes in the tutorial by David Hand from Leo Breiman (1995):
In courses I teach, one of my objectives is to take the mathematics of the algorithms and translate the practical meaning of what they do into understandable pieces so that practitioners can manipulate learning rates and hidden units, gini and two-ing, radial kernels and polynomials kernels. Understanding backprop isn't important to most practitioners, but understanding how one can improve the performance of backprop is very much a key topic for practitioners.
We need more Breimans to pave the way toward practical innovations in predictive modeling.
One problem in the field of statistics has been that everyone wants to be a theorist. Part of this is envy - the real sciences are based on mathematical theory. In the universities for this century, the glamor and prestige has been in mathematical models and theorems, no matter how irrelevant.I love this quote because it highlights the divide between the practical and the elegant or sophisticated. Data mining and predictive analytics are "low-brow" sciences, empirical, and practical. That doesn't mean that the mathematics aren't important; they are very much so. But while we wait for the elegances of a theory to trickle down to us, we still need solutions.
In courses I teach, one of my objectives is to take the mathematics of the algorithms and translate the practical meaning of what they do into understandable pieces so that practitioners can manipulate learning rates and hidden units, gini and two-ing, radial kernels and polynomials kernels. Understanding backprop isn't important to most practitioners, but understanding how one can improve the performance of backprop is very much a key topic for practitioners.
We need more Breimans to pave the way toward practical innovations in predictive modeling.
Subscribe to:
Posts (Atom)


 Posts


